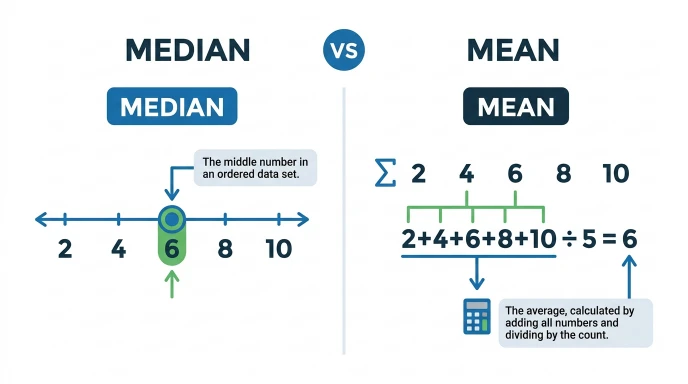
The median is the middle value in an ordered dataset, while the mean is the average calculated by adding all values and dividing by the total number of values.
Have you ever looked at test scores, salaries, or survey results and wondered if to use the mean or the median? Many people get confused because both measure the center of a set of numbers, but they work differently.
Understanding the difference between median and mean helps you choose the right measure for school, business, research, and everyday life.
In simple words, the mean is the average of all numbers, while the median is the middle value after arranging the numbers in order.
In this guide, you’ll learn the difference between median and mean with simple definitions, comparison tables, real-life examples, and practical tips.
Difference Between Median and Mean
The mean is calculated by adding all values and dividing by the total number of values. The median is the middle value in an ordered list.
Example: For the numbers 5, 8, 10, 12, 65, the mean is 20, while the median is 10 because the large value (65) increases the average.
What Is Median and Mean?
Median
The median is the middle number in a list arranged from smallest to largest. If there are two middle numbers, the median is their average.
Example: In 3, 5, 7, 9, 11, the median is 7.
Mean
The mean is the average of all numbers. Add every value together and divide by the total number of values.
Example: For 4, 6, 8, the mean is 6.
Pronunciation
| Term | US Pronunciation | UK Pronunciation |
| Median | /ˈmiː.di.ən/ | /ˈmiː.di.ən/ |
| Mean | /miːn/ | /miːn/ |
Now that you know the basic definitions, let’s explore the difference between median and mean in detail.
Difference Between Median and Mean Comparison
| Feature | Median | Mean |
| Definition | Middle value of ordered data | Average of all values |
| Calculation | Arrange data and find the middle | Add values and divide by total |
| Effect of Outliers | Hardly affected | Strongly affected |
| Best Used For | Skewed data | Evenly distributed data |
| Common Uses | Income, house prices | Test scores, temperatures |
| Data Requirement | Ordered numbers | All values included |
Key Differences Explained Between Median and Mean
1. Definition
The median is the middle value in an ordered dataset.
The mean is the average calculated from all values.
Example:
Scores: 60, 65, 70, 75, 95
- Median = 70
- Mean = 73
2. Calculation Method
Finding the median requires sorting the data first.
Finding the mean requires adding all values and dividing by the total number.
Example:
Numbers: 2, 4, 6
Mean = (2 + 4 + 6) ÷ 3 = 4
Median = 4
3. Effect of Extreme Values
The median is less affected by very high or very low numbers.
The mean changes significantly when outliers are present.
Example:
Data: 10, 12, 13, 15, 100
Median = 13
Mean = 30
The value 100 raises the mean but has little effect on the median.
4. Best Use Cases
Use the median when the data contains unusual values.
Use the mean when the data is fairly balanced.
Example:
- Average house prices → Median
- Average classroom marks → Mean
5. Accuracy in Different Situations
The mean gives a better overall average when data is evenly spread.
The median better represents the center when data is uneven.
This is why many reports on income use the median instead of the mean.
6. Real-World Applications
Median is commonly used in:
- Real estate
- Household income
- Population studies
- Economic reports
Mean is commonly used in:
- Science
- Education
- Business reports
- Sports statistics
Why Does the Difference Between Median and Mean Matter?
Choosing the right measure helps you interpret data correctly.
For example:
- A city may report the median income because a few very wealthy people can greatly increase the mean.
- A teacher often uses the mean score to calculate the average performance of a class.
- Researchers choose the measure that best represents the data they’re analyzing.
Using the wrong measure can give a misleading picture of the results.
How Is the Mean Calculated?
The mean follows a simple formula:
Mean = Sum of all values ÷ Number of values
Example:
Numbers: 8, 10, 12, 14, 16
Sum = 60
Mean = 60 ÷ 5 = 12
The mean uses every value in the dataset, making it useful when all observations are important.
How Is the Median Calculated?
To find the median:
- Arrange the numbers from smallest to largest.
- Find the middle value.
- If there are two middle values, calculate their average.
Example (Odd Number of Values):
3, 5, 7, 9, 11
Median = 7
Example (Even Number of Values):
2, 4, 6, 8
Median = (4 + 6) ÷ 2 = 5
Which Is Better: Median or Mean?
Neither is always better the right choice depends on the data.
Choose Median when:
- Data has extreme values (outliers)
- Income or property prices are being analyzed
- The data is unevenly distributed
- You need the middle value
Choose Mean when:
- Data is evenly distributed
- Every value should affect the result
- You’re calculating averages in science, education, or business
- You want the overall average
Understanding when to use each measure helps you analyze data more accurately and avoid misleading conclusions.
Difference + Similarity Between Median and Mean
| Feature | Median | Mean | Similarity |
| Definition | Middle value in ordered data | Average of all values | Both measure the center of a dataset. |
| Calculation | Arrange values and find the middle | Add all values and divide by the total | Both summarize numerical data. |
| Effect of Outliers | Rarely affected | Strongly affected | Both help analyze data. |
| Best Use | Skewed or uneven data | Evenly distributed data | Both are used in statistics. |
| Common Applications | Income, house prices, salaries | Test scores, temperatures, business reports | Both support decision-making. |
| Data Requirement | Ordered values | All values included | Both require numerical data. |
| Accuracy | Better with extreme values | Better with balanced values | Both provide useful insights when used correctly. |
This table clearly shows the difference and similarity between median and mean for quick understanding.
Common Mistakes with Median and Mean
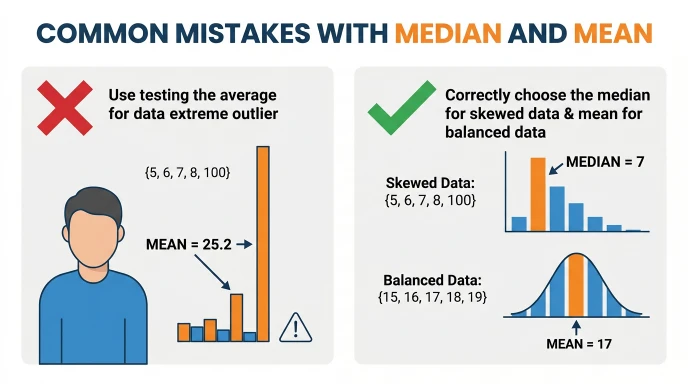
Many beginners confuse these two statistical measures. Here are the most common mistakes.
1. Thinking Mean and Median Are Always the Same
They can be the same in balanced datasets but often differ when extreme values are present.
Correction: Check if the data contains unusually high or low values before choosing a measure.
2. Using the Mean for Income Data
A few very high incomes can make the mean much higher than what most people earn.
Correction: Use the median for income and salary reports.
3. Forgetting to Arrange Numbers for the Median
The median can only be found after sorting the data.
Correction: Always place numbers in order before finding the middle value.
4. Ignoring Outliers
Extreme values can greatly change the mean.
Correction: If outliers exist, compare both the mean and median before drawing conclusions.
5. Assuming One Measure Is Always Better
Neither is better in every situation.
Correction: Choose the measure based on the type and distribution of your data.
Real-Life Examples with Median and Mean
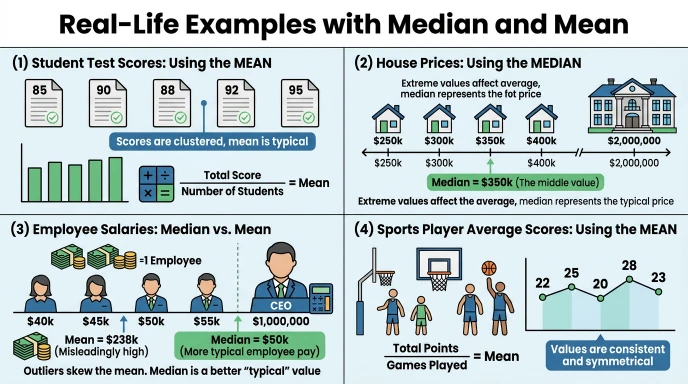
Example 1: Student Test Scores
A teacher calculates the mean score to find the class average.
Example 2: Home Prices
A real estate company reports the median home price because a few luxury homes can increase the mean.
Example 3: Employee Salaries
A company uses the median salary to show what a typical employee earns.
Example 4: Weather Reports
Meteorologists often use the mean temperature to calculate average weather conditions over time.
Example 5: Research Studies
Researchers compare both the mean and median to better understand data and identify unusual values.
When to Use Each
Use Median When You Need:
- Income or salary statistics
- House price analysis
- Skewed datasets
- Data with outliers
- The typical middle value
Use Mean When You Need:
- Average test scores
- Scientific calculations
- Business performance reports
- Temperature averages
- Evenly distributed data
Quick Tip: If a few values are much higher or lower than the rest, the median usually gives a more realistic picture.
Why People Get Confused About Median and Mean
The terms are often confused because both describe the “center” of a dataset.
Common reasons include:
- Both are measures of central tendency.
- They may have similar values in balanced datasets.
- Many people use the word “average” to mean both.
- School lessons often introduce them together.
- Both are widely used in mathematics and statistics.
The easiest way to remember the difference is:
- Mean = Average of all numbers.
- Median = Middle number after sorting.
How Search Engines Understand “Difference Between Median and Mean” and User Intent
When someone searches “difference between median and mean,” search engines like Google recognize that the user wants a simple comparison between two statistical concepts.
Google aims to show content that answers questions such as:
- What is the mean?
- What is the median?
- Which one should I use?
- How do I calculate each?
- Why are they different?
- What happens when there are outliers?
Articles that include comparison tables, formulas, examples, and practical use cases better satisfy search intent. Related terms such as average, statistics, data analysis, outliers, central tendency, dataset, and distribution help search engines understand the topic more completely.
Expert Insight
In real-world statistics, choosing the correct measure is more important than simply calculating it. The mean works best when data is evenly distributed because every value contributes to the final result. However, when extreme values are present, the median often provides a better representation of what is typical.
This is why economists frequently report median household income, while teachers, scientists, and businesses often rely on the mean for averages. Understanding the strengths of each measure helps you interpret data more accurately and make better decisions.
FAQs
1. What is the main difference between median and mean?
The mean is the average of all values, while the median is the middle value in an ordered dataset.
2. Which is better, median or mean?
Neither is always better. The best choice depends on your data. Use the median for skewed data and the mean for balanced data.
3. Why is the median less affected by outliers?
The median depends only on the middle position, so very high or low values have little effect on it.
4. How do you calculate the mean?
Add all the numbers together and divide by the total number of values.
5. How do you calculate the median?
Arrange the numbers in order and find the middle value. If there are two middle values, average them.
6. When should I use the median?
Use the median for income, salaries, house prices, or any dataset with extreme values.
7. When should I use the mean?
Use the mean for test scores, temperatures, scientific calculations, and evenly distributed data.
8. Can the mean and median be the same?
Yes. They are often the same or very close when the data is evenly distributed without outliers.
Conclusion
Understanding the difference between median and mean is essential for interpreting data correctly. Although both measure the center of a dataset, they serve different purposes. The mean calculates the average using every value, making it ideal for balanced data. The median identifies the middle value, making it a better choice when the data contains outliers or is unevenly distributed.
If you’re studying mathematics, analyzing business reports, reviewing income statistics, or conducting research, selecting the right measure leads to more accurate conclusions. By knowing when to use the mean and when to use the median, you can better understand data and make informed decisions in both academic and real-world situations.
Read more about!
Difference Between DisplayPort and HDMI: Easy Guide
Difference Between Velocity and Acceleration: Complete Guide

I am James Carter, a professional content writer from the United States. I specialize in writing simple and clear comparison blogs that help students and readers understand difficult topics easily. My writing focuses on everyday language, education, science, and lifestyle topics. I believe that learning should be easy for everyone, so I use simple words and real-life examples in my articles.